MOBILE NETWORKS INTERACTIVE PORTAL
Interactive portal was created to let anyone interested obtain information about mobile networks coverage maps in Serbia. It allows customers to view a complete coverage map for the entire territory of Serbia, by technology per mobile network operator (MNO) and thus check calculation of mobile network operators’ coverage and signal levels at locations throughout the country. Mobile networks coverage maps will allow users to see the level of mobile coverage where they work or live. It will also help customers when making choices between operators based on predicted coverage availability in defined area or chosen location.
The coverage map shows predicted mobile coverage of different technologies in outdoor conditions (outdoor coverage) across Serbia and at particular addresses or coordinates selected by customers. Also, customers can search and zoom in to a particular area or address.
It is displayed signal strength for all mobile network operators ranging from excellent, good, acceptable and unacceptable. In terms of coverage, legend indicates the following simplified explanations:
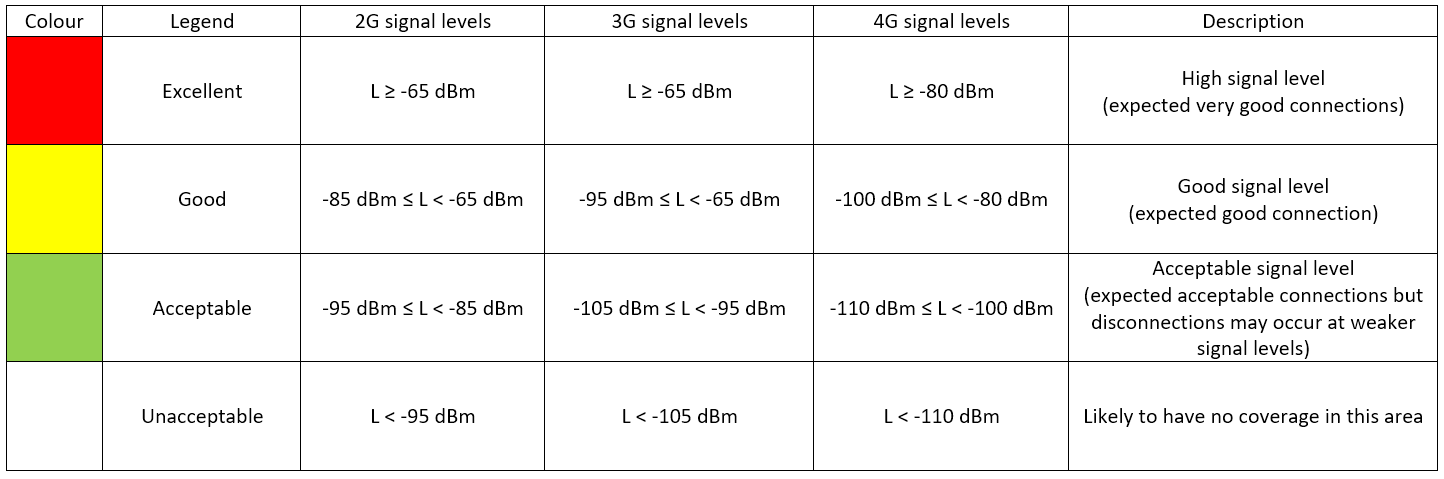
Given that coverage maps are based on coverage prediction, the accuracy of all results cannot be fully guaranteed. In addition, signal quality can be further degraded by the influence of the environment through which the signal propagates, different objects in the immediate environment, current traffic, or load (congestion) in the mobile network. Taking all this into account, it can be said that the calculation gives a good estimate of the signal level, and for accurate results it is necessary to perform measurements at a specific location.
Mobile networks coverage maps have been generated using data provided by the mobile network operators. RATEL periodically receives accurate datasets of network architecture from each network operator. A radio network planning tool is then used to process data and generate coverage predictions using an optimized RATEL prediction model in tandem with a digital terrain model (DTM) along with land type data (clutter data).
RATEL will update the map on a regular basis (quarterly) to reflect changes in predicted coverage as MNOs expand their networks.
Use header navigation and language selection
The portal header consists of navigation tabs and supports the selection of the display of the complete content of the page in the desired language via the language bar.
Using navigation
The header navigation (Figure 1) consists of four tabs, of which the default tab is "Map" whose main content is a map of mobile signal coverage with additional UI components. Switching to the desired tab is done with a simple mouse click, when the main contents of the tab will be displayed. Depending on the device (desktop, laptop, mobile phone...) through which we access the portal, the navigation bar adjusts and adapts to the level of the supported resolution of the access device (Figure 1).
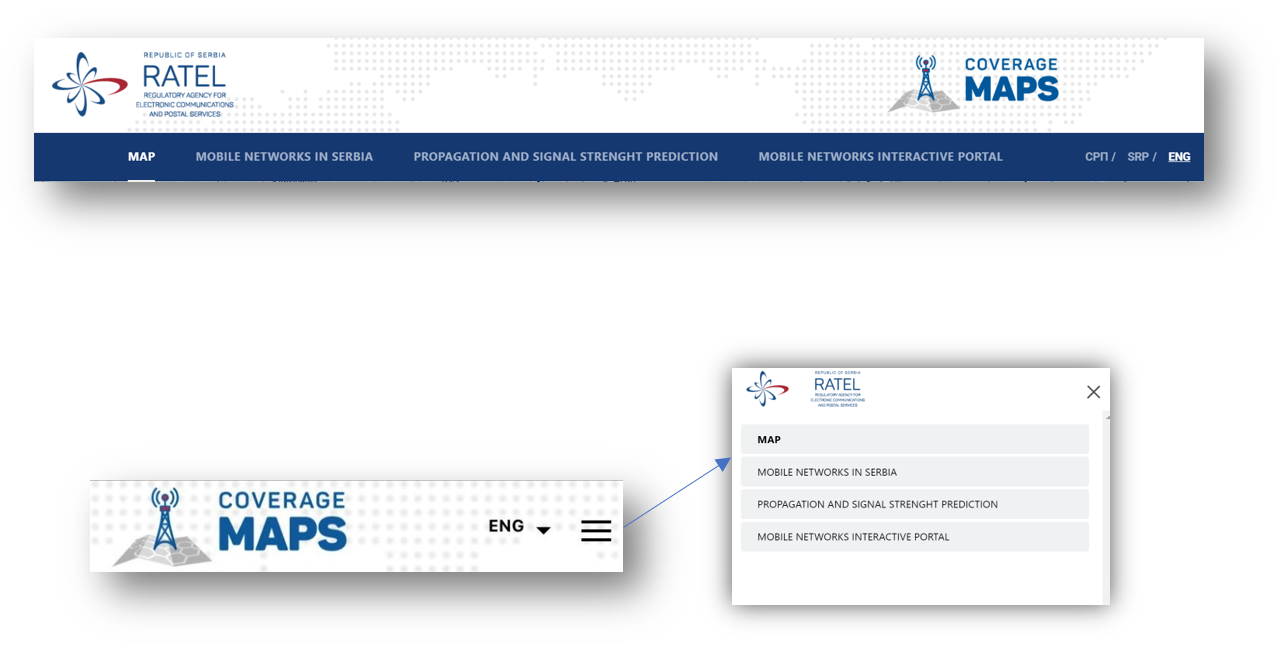 Figure 1. Header navigation
Language selection
The language is selected via the language bar by clicking or selecting from the drop-down menu the desired language in which we want the main content to be displayed. Depending on the device (desktop, laptop, mobile phone ...) through which we access the portal, the language bar adapts to the level of supported resolution of the access device (Figure 2).
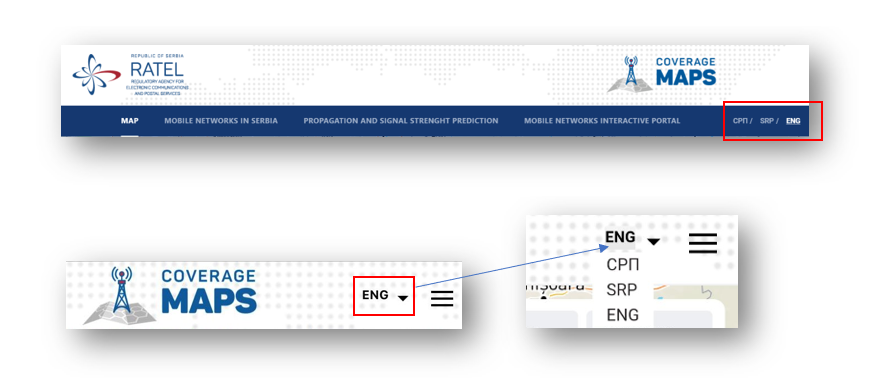 Figure 2. Language bar
Description and purpose of the UI component map
The map consists of two panels - functional and navigation, filter section and map palette (Figure 3).
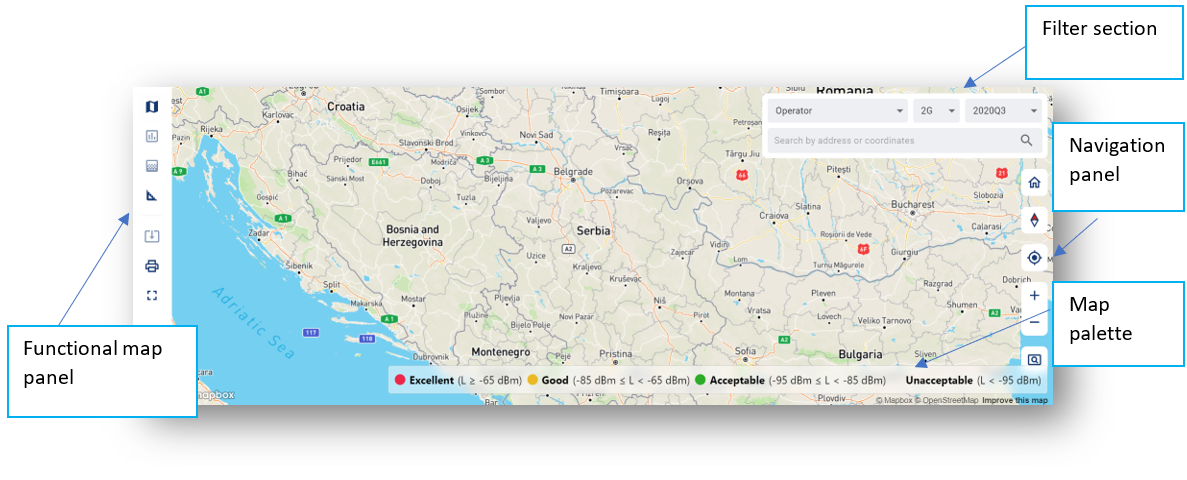 Figure 3. Map with displayed panels, filter section and map palette
Functional map panel
A functional panel is a UI component of a map that provides various functions when working with a map. Depending on the resolution of the access device, the functional panel can be horizontal or vertical (Figure 4).
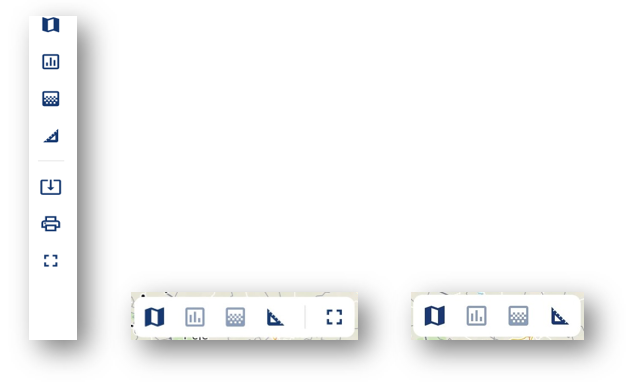 Figure 4. Vertical and horizontal functional panel (desktop, Android and iOS versions, respectively)
Functional panel features
The functional panel provides the following features:
- Base map
 whose click selects one of the three possible map layers (Figure 5) in the sidebar. The selection is made by clicking the mouse on the desired layer;
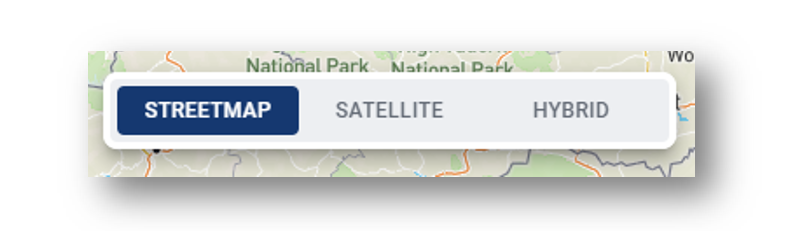 Figure 5. Selecting the base map
- Statistics
 whose click opens a new side bar with statistical data for the selected operator and technology as in the picture (Figure 6);
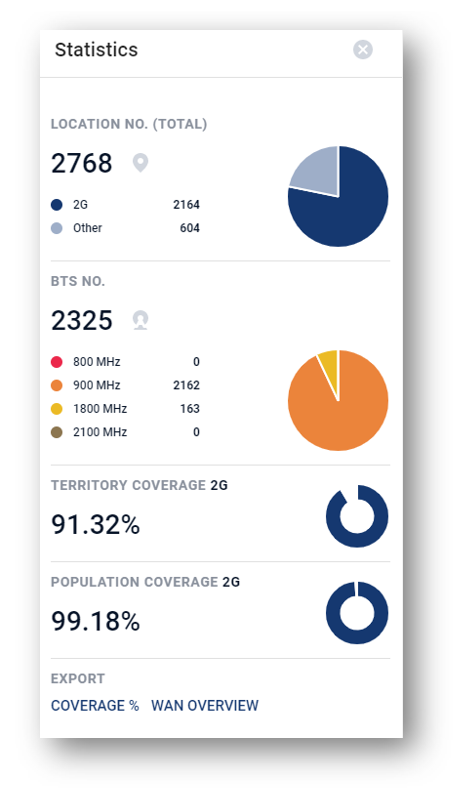 Figure 6. Sidebar with statistics
To download data / reports on coverage within the sidebar „Statistics" (Figure 7):
- by clicking on the "COVERAGE %" button, the report on the comparative presentation of the coverage of the territory / population by technologies is downloaded;
- by clicking on the "WAN OVERVIEW" button, the report with information on active base radio stations, repeaters and WiFi is downloaded;
 Figure 7. Download report
All reports are displayed in the language selected within the map header. The language selection is described in the chapter Use header navigation and language selection.
-
Transparency
 allows to adjust the transparency of the current coverage on the map. Clicking on the icon opens an additional bar with a slider to change the transparency value (Figure 8.) Current percentage of displayed transparency is shown in the upper right corner of the window;
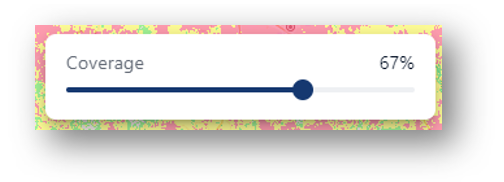 Figure 8. Transparency slider
-
Measure
 whose mouse click, the cursor switches to ruler mode which can be used to measure the distance between two locations on the map (mouse click for each location, Figure 9);
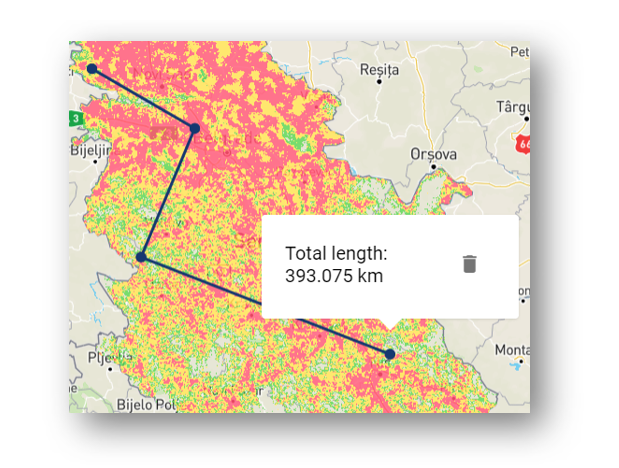 Figure 9. Total length measurement
- Coverage map export
 whose click exports the active coverage on the map in KMZ or KML format;
- Print
 whose click opens a dialog with the ability to print the current display on the page;
- Full screen
 whose click switches to full screen mode.
Map navigation panel
The map navigation panel (Figure 10) is a UI component intended for navigation on a map with standard functions.
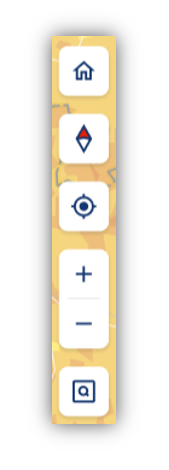 Figure 10. Map navigation panel
Map navigation panel functions
The navigation panel supports the following functions:
-
Map home
 whose click directs the map to the default position and zoom value;
-
Map orientation
 shows the current orientation of the map (red arrow points north). The orientation of the map can be changed by azimuth and elevation by simultaneously pressing the left mouse click and the CTRL button on the keyboard. Clicking the "Orientation" icon again automatically orients the map to the north;
-
My position
 orients and directs the map in accordance with the GPS position of the device with which we access the portal;
-
Zoom in / out
 to zoom in or out of the current map view;
-
Zoom to selection
 where the mouse cursor enters the rectangular zone mode in which we want to zoom in on the current map view.
Map filter section
The map filter section is a UI component that provides the following features:
-
display of coverage based on the selected operator, technology and time reference (quarter). The value is selected by clicking the mouse on the value from the drop-down menu, respectively (Figure 11);
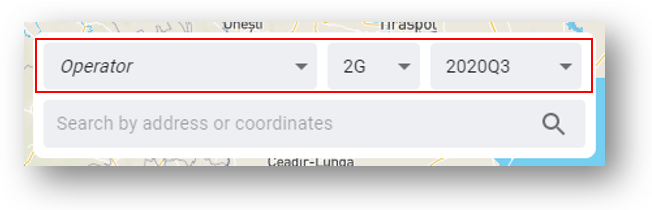 Figure 11. Drop-down menu for operator, technology and quarter selection
-
search and select a location on the map by entering the address or geographical coordinates (Figure 12). Values are entered in text format, where geographic coordinates are entered in standard (degree, minute, second) or decimal notation separated by a space (e.g. 20 28 03 44 47 52 or e.g. 20.46 44.79);
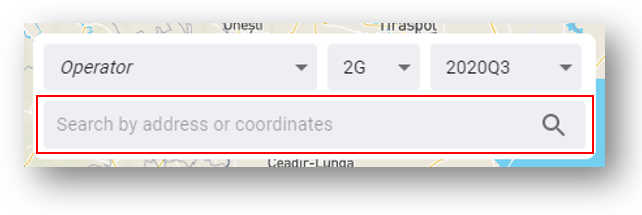 Figure 12. Field for entering the address or geographical coordinates
Map palette
The map palette is a UI component that represents a palette of predefined signal values according to the criteria for the corresponding colors. It can be positioned horizontally or vertically depending on the resolution and orientation of the access device (Figure 13).
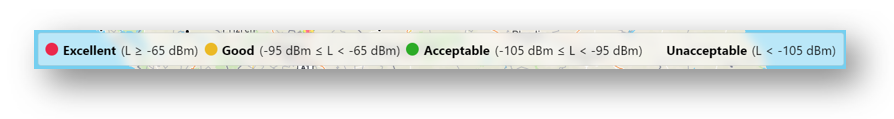 Figure 13. Map palette
Procedure for comparing the coverage signal quality between all operators
If we want to compare the quality of mobile signals between operators (or by technology), it is necessary to perform the following steps:
- select the desired location by clicking on it (the approximate location can be entered in the field for entering the address or geographical coordinates)
-
after that, a pop-up window will appear with the "COMPARE" button, which also contains the signal value for the previously selected operator, technology and quarter (Figure 14).
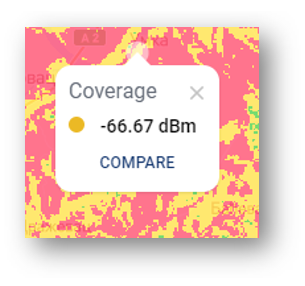 Figure 14. Window with "Compare" button
-
clicking on the "COMPARE" button opens a new side bar with information on the signal values of all operators at the selected location. Additionally, it is possible to compare the signal values of different technologies by selecting the comparison by technology from the drop-down menu (Figure 15).
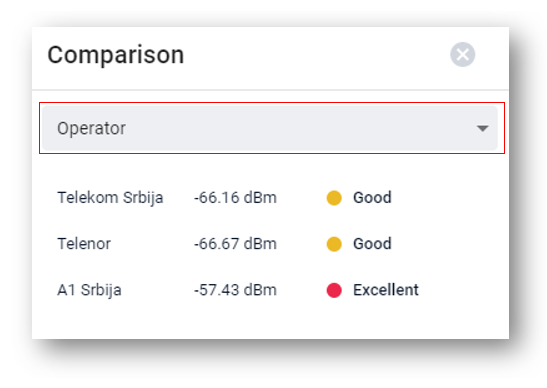 Figure 15. Comparison of operator signal values and technologies


- Coverage map export